GLD’s Worst Week in Four Decades: Trading the Pullback With a Put Calendar Spread

Key Points
- GLD fell more than 10% this week — its worst performance since 1983 — despite the ongoing Iran conflict.
- A stronger dollar and surging yields are driving the selloff, not a lack of geopolitical risk.
- Key technical levels have broken. The YTD low around $400 and the 200-day SMA near $375 are the next downside targets.
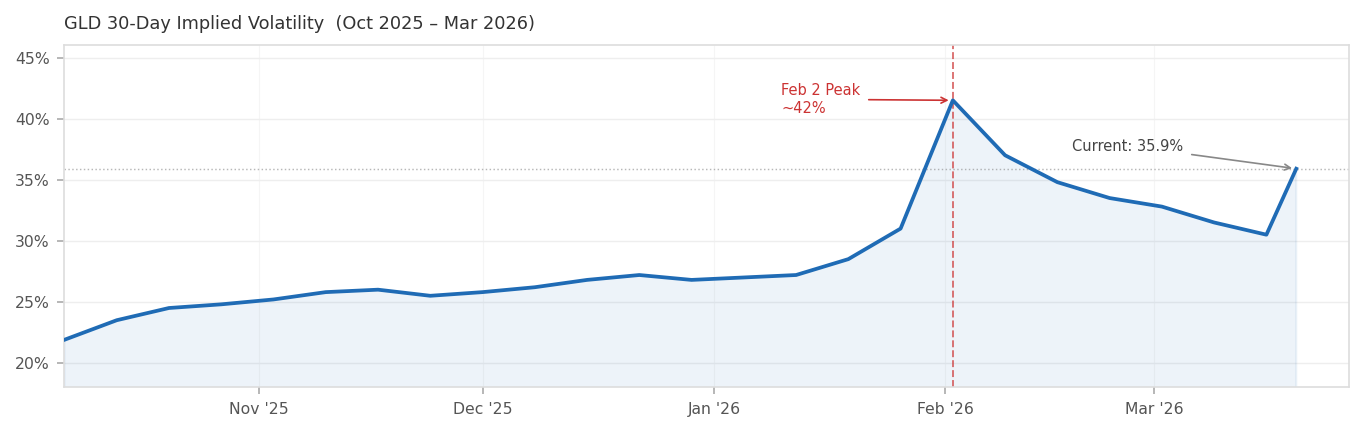
- 30-day IV has risen to ~36% but remains below the 42% February peak — a moderate-premium environment suited to calendar spreads.
Why Gold Is Falling Despite the War
Gold is supposed to rally when the world is at war. That rule has failed spectacularly since the U.S. and Israel launched strikes on Iran on February 28. GLD fell more than 10% this week alone — its steepest weekly decline since 1983 — closing Thursday at $426.41, off more than 4% in a single session.
Three forces explain it. A flight to the dollar has suppressed gold’s appeal internationally. Treasury yields have surged rather than fallen — the 10-year hit 4.39%, its highest since July — as oil-driven inflation has been priced out every Fed cut for 2026, with some desks now pricing odds of a hike. And institutional forced liquidation accelerated the move: on March 4 alone, GLD recorded a $2.91 billion outflow — the largest single-day withdrawal since 2016. The paradox is stark: the oil shock driving the war premium is the same force making gold uncompetitive against Treasuries.
Technical Picture: Key Levels Have Given Way
- February 2nd low and the 100-day SMA have both been broken, removing two layers of support and likely triggering systematic selling from trend-following funds.
- Next major downside target is near the YTD low around $400. Below that, the 200-day SMA near $375 is the natural destination in a sustained breakdown.
- The broken 100-day SMA — now in the $425–$428 zone, aligning with the March 19–20 highs — has flipped to resistance and defines the level at which the bearish thesis is negated.
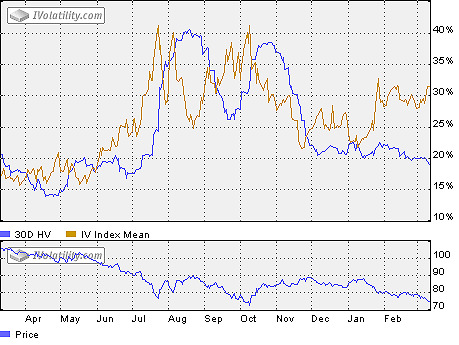
Implied Volatility: Elevated but Below the February Peak
30-day implied volatility has moved to approximately 35.9% over the past several days. That is well above the 21%–27% range that prevailed from October through mid-January, but remains below the 42% spike recorded on February 2. The chart below illustrates the full arc.
This positioning suits the calendar spread structure well. Current IV is elevated enough that selling the near-term April 2 puts generates meaningful premium — but not so elevated that the long May leg is prohibitively expensive. A secondary IV spike on another leg lower would benefit the long put through both delta and vega.
Trade Structures
The April 2, 2026 weekly expiration anchors the short leg; May 15, 2026 provides the long leg sufficient duration. Two strikes are worth considering, and can be combined into a double calendar.
Trade 1: $400 Put Calendar — Semi-Bearish
- Buy: GLD $400 Put, May 15, 2026
- Sell: GLD $400 Put, April 2, 2026
- Net Debit: Approximately $5.95
- Best case: GLD trades near $400 as April 2 approaches. The short put decays rapidly while the long May put retains value.
- Strike rationale: The $400 area aligns with the YTD low — the first major technical target on a continuation of the breakdown.
Trade 2: $380 Put Calendar — More Bearish
- Buy: GLD $380 Put, May 15, 2026
- Sell: GLD $380 Put, April 2, 2026
- Net Debit: Approximately $3.50–$4.50 (indicative; verify current market prices)
- Best case: GLD continues lower through April toward the 200-day SMA near $375.
- Strike rationale: Targets the deeper breakdown scenario at the 200-day moving average.
Trade 3: Double Calendar — Structured Range Play
Combine the $400 and $380 calendar spreads simultaneously.
Creates a wider profit window if GLD settles anywhere in the $380–$400 range by early April. More capital-intensive, but offers a broader sweet spot for traders who want to hedge the precise landing zone.
Risk Management: Where the Thesis Breaks Down
- A sustained close above $425–$428 — the broken 100-day SMA and the March 19–20 highs — is the primary stop signal.
- A credible ceasefire or de-escalation in Iran could rapidly reverse the macro forces at work: lower oil prices, easing inflation expectations, and relief on yields would all be bullish for gold.
- A material dollar reversal or Fed pivot signal would similarly undercut the bearish case.
The long-run fundamental case for gold remains intact — J.P. Morgan carries a year-end gold target of $6,300/oz and Deutsche Bank $6,000 — and central bank demand continues to provide a structural floor. These structures are tactical, not strategic. Neither should represent more than a small allocation within a diversified options portfolio.
DISCLOSURE
This article is for informational and educational purposes only and does not constitute investment advice. Options trading involves substantial risk of loss and is not appropriate for all investors. All option prices and technical levels referenced are approximate and subject to change. Consult a qualified financial professional before making any investment decisions. WeeklyOptions.com does not hold any positions in GLD at the time of publication.