ORCL Post-Earnings: A Possible Bottom and How to Trade It With Options

Key Points
- Oracle posted blowout Q3 2026 earnings, but the stock remains near multi-year lows due to ATM dilution risk and a $100B+ debt load.
- Both overhangs have been weighing on the stock since last Fall — they may already be fully priced in.
- Wall Street cut targets post-earnings, but most analysts still see 30–90% upside from current levels.
- Technicals indicate a potential bottom; a break above the 50-day SMA could trigger a run to $180–$190.
- Post-earnings IV compression makes buying June calls an attractive defined-risk way to play a recovery.
A Landmark Quarter the Market Has Not Rewarded
Oracle (NYSE: ORCL) reported fiscal Q3 2026 results on March 10 that, by most measures, were exceptional. Total revenue climbed 22% year-over-year to $17.2 billion, topping the Wall Street consensus of $16.9 billion. Non-GAAP EPS came in at $1.79, well ahead of estimates near $1.70. Cloud infrastructure revenue — the segment most closely watched by AI investors — surged 84% to $4.9 billion. Remaining Performance Obligations reached $553 billion, up 325% from the year prior. Management raised its FY2027 revenue guidance to $90 billion. By the company’s own characterization, it was the first time in over 15 years that organic total revenue and non-GAAP EPS both grew 20% or more in the same period.
Despite all of this, ORCL shares were trading in the low $160s by the close of the week — still well below the $179 level briefly touched in late January, and down more than 50% from the September 2025 all-time high near $345.
The Overhang: ATM Dilution and Debt
The gap between Oracle’s business momentum and its stock performance is largely explained by two well-known structural overhangs. On February 1, 2026, the company announced a $45 to $50 billion capital raise, including a $20 billion at-the-market equity offering through a syndicate of major banks and a $25 billion senior notes issuance. The ATM program creates persistent, uncertain dilution risk: every day the stock rallies, the market must price in the possibility that Oracle is selling shares into the move.
The company’s long-term debt has also swelled above $100 billion to fund its AI data center buildout, contributing to negative trailing free cash flow. The bear case is real. But crucially, it is not new. These risks have been fully public since early February and have been reflected in every trading session since. The question for investors now is whether the discount is sufficient.
Analyst Targets: Down From Highs, But Still Far Above the Stock
In the days following the earnings release, Wall Street moved to update its models. The pattern was consistent: price targets came down across the board to reflect the ATM dilution, the elevated debt load, and more conservative margin assumptions. But even after those reductions, the gap between analyst consensus and the current stock price remains striking.
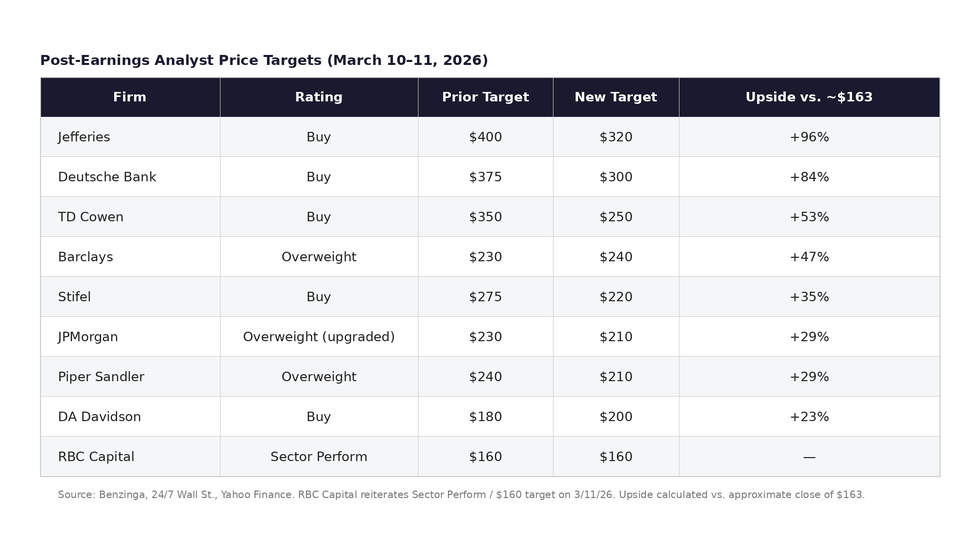
JPMorgan upgraded ORCL to Overweight from Neutral, citing an improved risk-reward profile after the extended sell-off, and established a $210 price target. Barclays raised its target to $240, stating the Q3 results addressed key investor concerns around capital expenditure and contract margins. Piper Sandler maintained Overweight but trimmed to $210 from $240, reflecting a broader software sector multiple de-rating. Stifel maintained Buy while lowering to $220 from $275. TD Cowen and Deutsche Bank both retained Buy ratings with targets of $250 and $300 respectively. DA Davidson raised its target to $200 from $180. The lone dissenting voice among recent actions was RBC Capital, which on March 11 reiterated its Sector Perform rating and maintained a $160 price target — essentially in line with where the stock is currently trading.
The table below summarizes recent analyst actions. With the exception of RBC, even the most cautious targets on the list sit meaningfully above current trading levels — suggesting the broader Street views the debt and dilution concerns as known, manageable, and already discounted.
Technical Picture: Watching the 50-Day SMA
The technical setup is constructive but not yet confirmed. Several key observations:
- The February 26 lows have held. The stock tested that level and did not break below it, establishing at least a near-term floor.
- ORCL is currently trading above its 20-day simple moving average, a short-term bullish sign that suggests immediate selling pressure has eased.
- The 50-day SMA sits just above current price levels and represents the next meaningful resistance zone. A sustained close above the 50-day SMA would likely attract technical buying and could set the stage for a run toward the $180 to $190 range, which aligns with the late January highs.
- Key support to watch sits in the $152 to $150 area. A convincing break below this zone would negate the bullish read and would likely invite a retest of the February lows.
Options Strategy: Taking Advantage of the Post-Earnings IV Drop
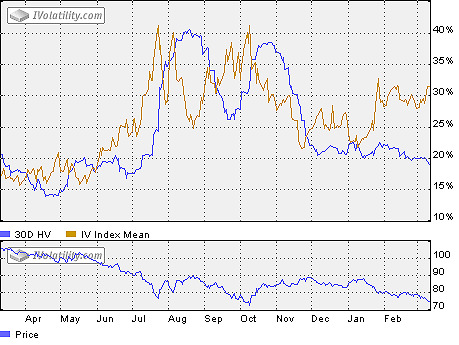
One of the more favorable dynamics following earnings is the compression of implied volatility. Options prices — and specifically the time value embedded in them — tend to be elevated heading into a quarterly report, then collapse once the event risk is removed. With ORCL’s earnings now behind us, implied volatility has declined to more normalized levels, which reduces the cost of purchasing options outright.
The June 18, 2026 expiration is the logical anchor for a long position in ORCL options for two reasons. First, it captures the next earnings announcement, currently expected on or around June 10, 2026, which will be Q4 FY2026 results and likely the next major catalyst. Second, it provides sufficient time for the technical breakout above the 50-day SMA to materialize, without overpaying for a weekly or monthly option where time decay is more punishing.
Two specific structures are worth considering at current levels:
Trade Structure 1: Diagonal Spread
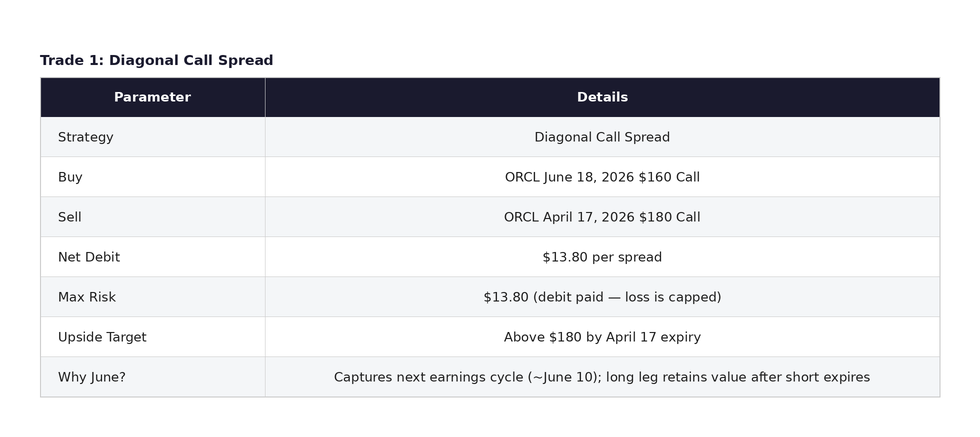
The diagonal spread structure buys time and sells the near-term move. By purchasing the longer-dated June $160 call and selling the shorter-dated April $180 call, the trader finances a portion of the long option’s cost. If ORCL rallies to or above $180 by the April 17 expiry, the short call expires in-the-money and the position benefits from the gains in the long June call. If the stock consolidates through April, the short call decays in the trader’s favor and the long June call retains much of its value heading into the next earnings cycle.
Trade Structure 2: Vertical Call Spread
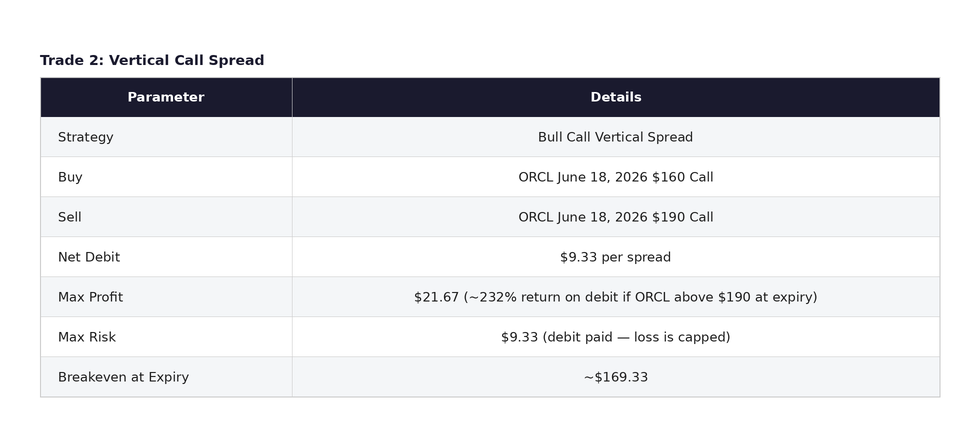
The vertical spread offers a lower-cost, defined-risk approach for traders who believe ORCL will trade between $170 and $190 by mid-June. The maximum gain of $21.67 represents a potential return of approximately 232% on the $9.33 debit if ORCL trades above $190 at expiration. For more conservative traders, the vertical spread may be the preferred vehicle given its lower capital requirement and simpler management profile. The diagonal offers more flexibility across two expiration cycles but requires closer attention as April 17 approaches.
Risk Management: Where the Thesis Breaks Down
The technical setup is constructive but not yet confirmed. Several key observations:
Key support to watch sits in the $152 to $150 area. A convincing break below this zone would negate the bullish read and would likely invite a retest of the February lows.
- A daily close below the 20-day SMA would be the first warning sign. This would suggest the post-earnings bounce has stalled and that near-term momentum has turned negative.
- A break and sustained close below the $152 to $150 support zone would be the primary stop trigger. This level represents the intersection of recent technical support and the pre-earnings consolidation range. If ORCL trades below this zone on meaningful volume, the position should be exited, as the next likely destination is a retest of the February lows.
- Any unexpected news related to the ATM program — for instance, evidence that Oracle is selling shares aggressively into the current rally — would constitute new negative information not yet priced into the stock.